Blog
Shifting to an Observability Mindset from a Developer's Point-of-view
Learn how tracing completes the Observability picture beyond logs and metrics, helping developers proactively spot performance issues in distributed systems.
Apr 10, 2025
Over the years, I've done my fair share of tracking down weird latency anomalies or errors in production environments, sometimes in response to hard-to-reproduce incidents. I would always find myself hoping there were thoughtfully placed statements in the code that I could rely on for clues. Many times, the latency didn't trigger any meaningful logs and there was no error to surface the issue . Even when I would find interesting logs, it rarely told me why it was only an issue sometimes.
It became apparent that even thoughtful logging allowed for important indicators to fall through the cracks. Perhaps they were things that couldn't be predicted to turn into future issues at the time. As it often turns out, the log statement alone, carefully crafted as it is, doesn't scale well with large, distributed systems and the ways in which users interact with them. Logs aren't particularly suited at detecting bottlenecks, especially when they are primarily focused on catching errors, which may not exist yet.
Evolving Observability
Developers evolve their Observability posture over time, moving from logging to structured logging, and exporting metrics as well. In doing this, we start to increase the kinds of questions we can ask. While this helps, there are still blind spots until we add tracing . Traces (or enhanced logs) allow us to move from a primarily reactive mindset to a proactive, Observability-driven one. Adopting an Observability-first mindset requires understanding of what each layer offers.
If you're a fan of learning by demonstration, I've included a demo repo containing a non-obvious problem to debug. I'll show how each layer of Observability tooling gives a clearer picture of the problem. You can find the repo here. I'll include screenshots of each layer in action inline below.
Logging
Logging is the most familiar approach: adding log statements in important code paths to capture what happened at a specific time. Frameworks can enhance logs with correlation data so developers can link events across multiple services. Structured logs are an improvement over unstructured logs and can add query-ability on some level.
While structured logging can add value in a distributed context, you are still left with an incomplete picture. If you do manage to add "enough" logging, you are likely to be left with "log soup", an overly verbose collection of logs obscuring your business logic. Thankfully, there are better tools for detecting issues and I'll highlight the value each brings as we mature our Observability posture.
Example (Logging)
After checking out the `v0.1-unstructured-logs` tag, running the test requests against the app produces logs like the following:

You can see intermittent failures, but it's hard to track down with simple logging alone. The logs aren't explicit or connected enough to paint a complete picture. In the cases with no error, it is hard to determine whether anything is wrong at all.
Example (Structured Logging)
If you check out the v0.2-structured-logging tag and run the same tests, you get a little more information around the running code.

There are clues in the logs, but the root cause of the intermittent error isn't apparent here or when looking at the code.
Metrics
Metrics track system performance and thresholds, like CPU usage, memory consumption, and request latency. Teams can define what “healthy” metrics look like and set up alerts for when they drift outside expected ranges. Given timestamped logs, you can correlate unusual metrics at the same times. While this is an improvement over logs alone, manually correlating metrics with logs is error-prone and time consuming.
Example (Metrics)
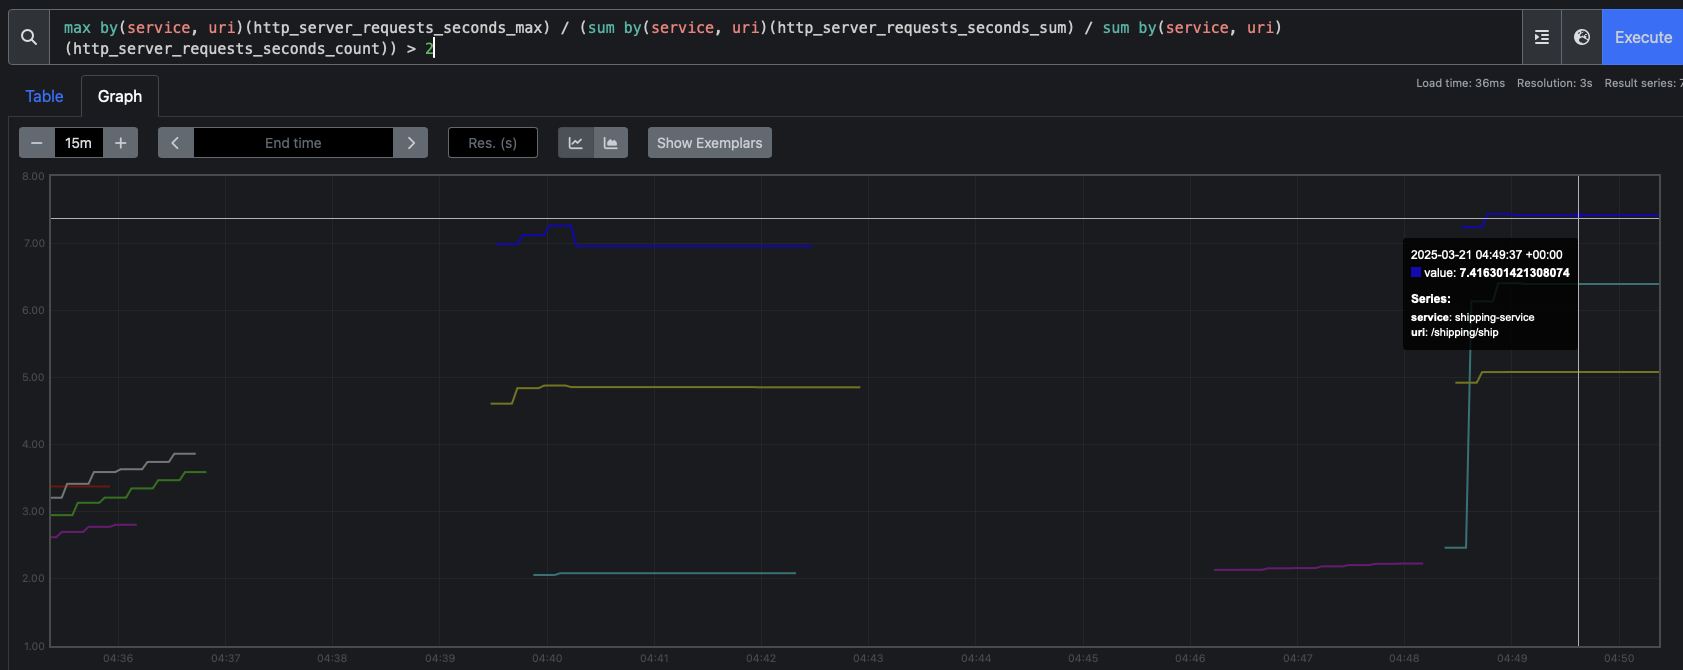
You can check out the v0.3-metrics tag and run the tests again to see something on the metrics dashboard in Prometheus or Grafana. While it appears obvious that there is an issue, we'll have to tie these metrics back to logs from the same timespan.
Tracing
Tracing, when set up properly, ensures you can ask any question about how your system is functioning– even questions you never considered when writing your code. Collecting logs, metrics, and traces in a way that reveals the entire lifecycles of requests and services, letting you spot anomalies and bottlenecks before they become outages. This level of Observability moves beyond reactively responding to incidents after they occur; instead, it allows teams to address issues proactively, especially in modern, distributed architectures.
Example (Tracing)
Check out v0.4-tracing tag and run the tests again to see the trace errors in Jaeger. Spans have been added using OpenTelemetry.
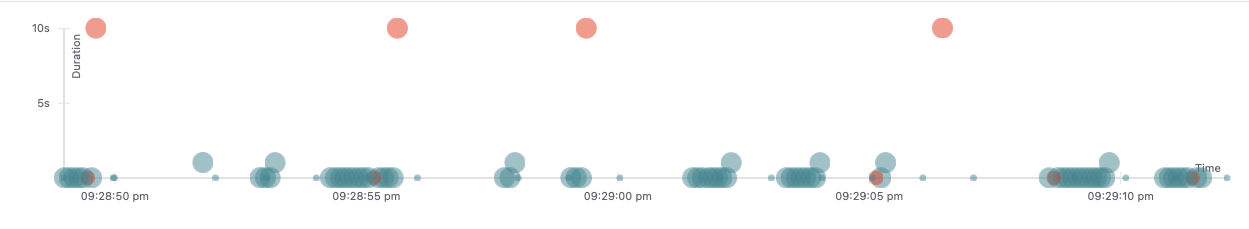
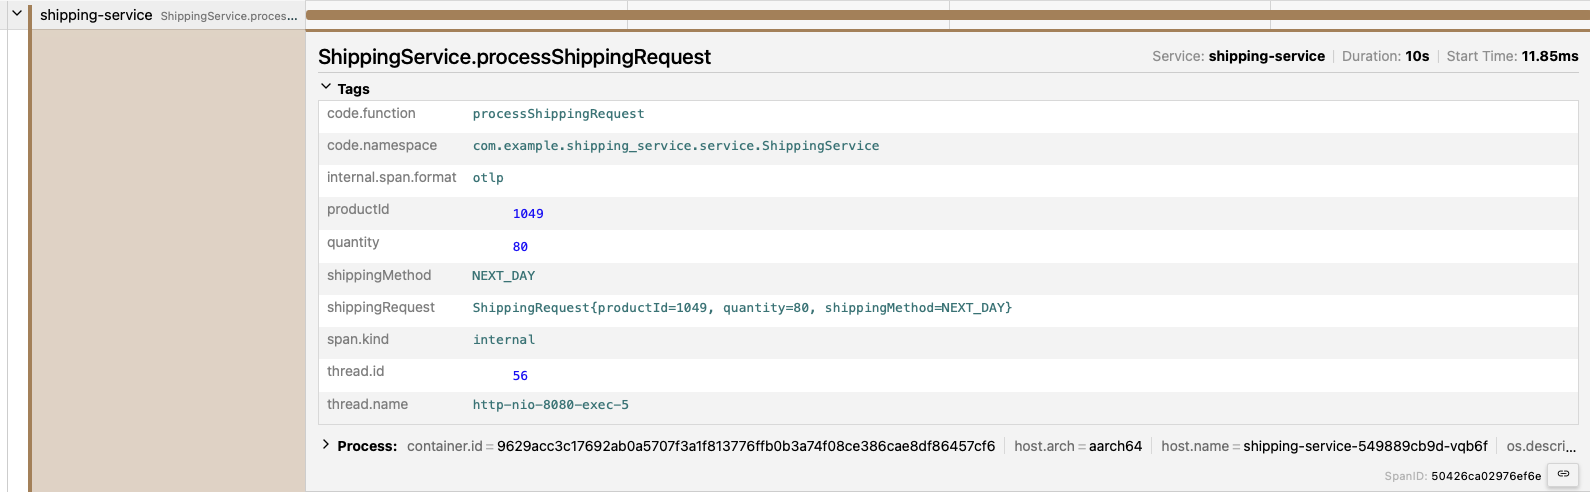
In our example, you can clearly see trace errors as outliers in the UI (shown as red circles and taking over 5 seconds). Now I can query the traces with questions like: "What are the values for quantity and shipping method when the request latency is over 5 seconds". I would then see that the latency is happening with only high quantities over 75 and always with a shipping method of "NEXT_DAY". I am able to spot these issues visually and ask questions proactively, and without having to write code to do so.
You can visually see something of interest here and start to dig in to find commonalities between these anomalies that are showing as failure cases in our example. You may not always have an error to catch your attention, but seeing a graph of requests like this grabs my attention right away.
It is easy to visually inspect the trace here and see which span in the trace is the culprit.
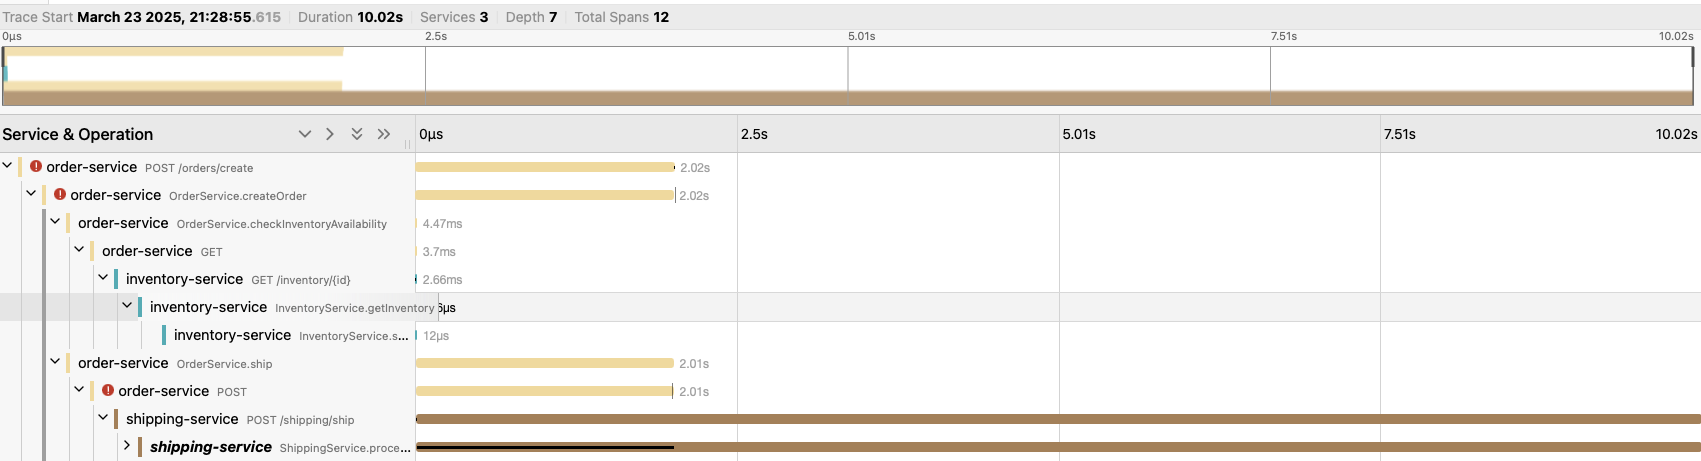
I have a couple data points here that can be queried to find a pattern. While I had manually added these attributes to the span, the method arguments can be automatically added if I set the right environment variable for the agent.
Shifting Mindset
Shifting to an Observability mindset means you're no longer chasing vague error messages or sifting through incomplete logs. Instead, you instrument your code and continuously analyze telemetry data for new issues. Rethink development workflows by incorporating real-time feedback loops and performance data in local testing or staging environments. In return, you gain a deeper, more dynamic view of your entire application landscape, and a sense of security that gives more confidence than from logs alone.
If your first question is "where do I start?" the answer may be auto-instrumentation. Auto-instrumentation is the process of adding libraries that inspect your runtime environment and add appropriate instrumentation based on that environment. This allows you to take advantage of the built-in Observability capabilities of your runtime while still maintaining control over the instrumentation logic.
Instead of questioning whether you've added enough logging to save your future self, you can use a set of tools that act as a safety net, even in a future you can't predict."
Wrapping it Up
If you were following our example, we tracked down an error with increasing levels of Observability tooling. Ultimately the issue is that a (simulated) third-party shipping service starts responding with extreme latency under a specific combination of request properties, causing a request timeout in one of our services. Imagine if we did not have a connection timeout and we were trying to discover the cause of the latency. Logging and metrics telemetry alone would have made seeing the problem or tracking it down very difficult. With Traces and the ability to query the system in simple, yet powerful ways, we can quickly track down the cause.
I hope that this article has made it clear that I am not steering you away from the tools you already use to add Observability to your apps. Instead, I want to demonstrate the value of a more proactive approach to Observability than logging alone and the tools that can help you get there. Instead of questioning whether you've added enough logging to save your future self, you can use a set of tools that act as a safety net, even in a future you can't predict.
Upcoming: AI in Observability
AI can be immensely helpful when sifting through Observability data. Even given a mature telemetry setup that enables you to ask questions you never explicitly planned for, it can still be hard to know which questions to ask, especially when dealing with massive amounts of logs, metrics, and traces. Honeycomb.io helps with this, for example, via Query Assistant which allows the user to express their query in plain english and get a meaningful query to match based on the data in their system. AI tools can help by combing through your data, identifying patterns, highlighting outliers, and even suggesting the right queries or dashboards to surface hidden issues.
For example, an AI-driven Observability tool might detect discrepancies in pieces of data that you wouldn't have noticed before it escalated into a major incident. It can also correlate events from multiple services to pinpoint the underlying cause. By surfacing potential anomalies or unusual performance trends, it helps us to know which questions we might not know to ask. In the Honeycomb platform, one tool for this is called BubbleUp. BubbleUp uses machine learning to surface potentially unnoticed anomalies. Attached to traces and metrics, these insights are hard to uncover manually.
AI augments human intuition in leveraging these tools. As system complexity grows, tools like these help in the task of maintaining Observability coverage across the organization. Embracing AI tooling in Observability, we can continue to innovate and increase our trust in large systems, even as systems grow to new levels of size and complexity.
Additional Resources
OpenTelemetry(Observability tooling used in this example)Honeycomb.io(Observability Platform offering AI and Machine Learning features)GitHub Repo
/Contact Us

Modernize your legacy with Focused
Get in touch